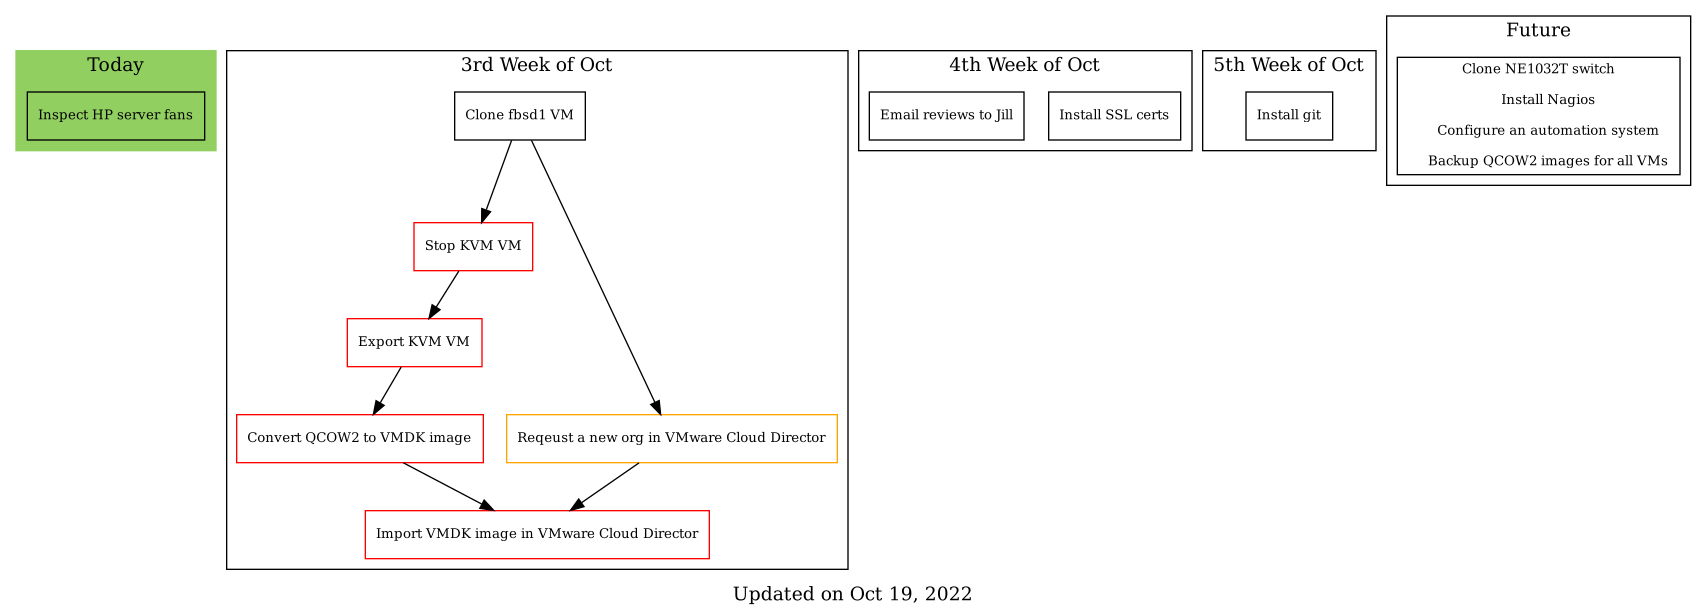
OS: FreeBSD 13, Shell: csh
$ cat timegraph.gv
/*
  Colours:
    green = done
    orange = in progress
    red = not started
 */

digraph timegraph
{

  /*
    Graphviz - FaqClusterEdge - How can I create edges between cluster
  boxes? http://www.graphviz.org/content/FaqClusterEdge
  */
  compound = true;

  graph [newrank = true];
  node [fontsize=10, shape = box];
  splines = "line"; // Force edges to be straight, no curves or angles

  subgraph clusterToday
  {
    label = "Today";
    style = "filled";
    color = "#91cf60";

    "Inspect HP server fans";
  }

  subgraph clusterTomorrow
  {
    label = "Tomorrow";

    //{ rank = same; "Email backupmap" ; }
  }

  subgraph clusterWeek1
  {
    label = "1st Week of Oct";
  }

  subgraph clusterWeek2
  {
    label = "2nd Week of Oct";
  }

  subgraph clusterWeek3
  {
    label = "3rd Week of Oct";

    CVM [label = "Clone groups2 VM"];
    SVM [label = "Stop KVM VM", color = "red"];
    EXVM [label = "Export KVM VM", color = "red"];

    /*
      Group these three nodes - to keep the edges straight.

      From Graphviz documentation:  Attributes - group:
        Name for a group of nodes, for bundling edges avoiding crossings.
        If the end points of an edge belong to the same group, i.e., have the
        same group attribute, parameters are set to avoid crossings and keep
        the edges straight.
    */
    CVRT [group = gConvert, label = "Convert QCOW2 to VMDK image", color = "red"];
    CNO [group = gConvert, label = "Reqeust a new org in VMware Cloud Director", color = "orange"];
    IMPIMG [group = gConvert, label = "Import VMDK image in VMware Cloud Director", color = "red"];

    CVM -> SVM -> EXVM -> CVRT;
    CVM -> CNO;
    CNO -> IMPIMG;

    CVRT -> IMPIMG;
  }

  subgraph clusterWeek4
  {
    label = "4th Week of Oct";
    "Install SSL certs";
    "Email reviews to Jill";
  }

  subgraph clusterWeek5
  {
    label = "5th Week of Oct";
    "Install git";
  }

  subgraph clusterFuture
  {
    label = "Future";

    "Clone NE1032T switch\n
     Install Nagios\n
     Configure an automation system\n
     Backup QCOW2 images for all VMs";
  }

  label = "Updated on Oct 19, 2022";
}
Command to generate diagram:
$ dot -Tpng timemgraph.gv -o timemgraph.png
Command to view the graph:
$ xv timegraph.png
Command to generate diagram with the make(1) tool.
First create the Makefile file.
Note: Each of the lines with target in the Makefile must be preceded by a tab (in this case, lines with dot, rm, and xv commands).
$ cat Makefile
timegraph.png timegraph.pdf: timegraph.gv
	dot -Tpng timegraph.gv -o timegraph.png
	dot -Tpdf timegraph.gv -o timegraph.pdf
	xv timegraph.png
clean:
	rm -i *png *pdf
Use the make(1):
$ make
When you want to delete generated PDF and PNG files:
$ make clean
% xv timegraph.png

Note: To see the image in full size in a web browser, right-click on it and select “Open Image in New Tab”.
References
Project Management as Code with Graphviz
A Technique for Drawing Directed Graphs
Manpages for: make(1), style.Makefile(5) (on FreeBSD)