OS: FreeBSD 13
Shell: csh
Install Kroki or PlantUML as
per this
or this
or this.
Start Kroki and/or PlantUML as explained in the above resources:
- Start Kroki on FreeBSD 13 with Java, with the web server running locally on port 8000:
% cd /path/to/kroki-server-directory

% java -jar kroki-server.jar
OR:
- Start Kroki on FreeBSD 13 with vm-bhyve and Linux VM, with the web server running locally on port 8080:
% docker -H "tcp://dusko@$DOCKER_HOST":2376 \
 run -d --name kroki -p 8080:8000 yuzutech/kroki
OR:
- Start PlantUML Server Locally on FreeBSD, with the web server running locally on port 8080:
% cd /path/to/plantuml-server-directory

% mvn jetty:run
NOTE:
This page assumes that you started Kroki on FreeBSD 13 with Java, with the web server running locally on port 8000.
Install HTTPie (pronounced aych-tee-tee-pie), a command line HTTP client.
% sudo pkg install py38-httpie
Send a JSON Request to Graphviz Library Running on Kroki
% http \
 http://localhost:8000/ \
 diagram_type='graphviz' \
 output_format='svg' \
 diagram_source='digraph G {Hello->World}' > \
 hello.svg
% file hello.svg
hello.svg: SVG Scalable Vector Graphics image

% rsvg-convert hello.svg > hello.png

% file hello.png
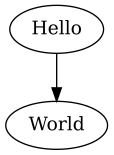
hello.png: PNG image data, 114 x 155, 8-bit/color RGBA, non-interlaced
% xv hello.png
Send a File to PlantUML Library Running on Kroki
For instance, send a DOT file (graph description language - mostly used by Graphviz) named hello.dot:
% printf %s\\n 'digraph G {' > hello.dot
% printf %s\\n '    Hello->World' >> hello.dot
% printf %s\\n '}' >> hello.dot
% cat hello.dot
digraph G {
    Hello->World
}
% cat hello.dot | \
 http \
 http://localhost:8000/plantuml/svg Content-Type:text/plain > \
 hello.svg
% cat hello.dot | \
 http \
 http://localhost:8000/plantuml/svg Content-Type:text/plain > \
 hello.svg
% file hello.svg
hello.svg: SVG Scalable Vector Graphics image

% rsvg-convert hello.svg > hello.png

% file hello.png
hello.png: PNG image data, 114 x 155, 8-bit/color RGBA, non-interlaced
% xv hello.png
How to Create a Network Diagram with Graphviz - Send a File to PlantUML Library Running on Kroki
Mike Griffin’s GitHub repository contains the code used in his graphviz tutorial blog post.
(Retrieved on Feb 26, 2022)
If you don’t have Git on your system, install it:
% sudo pkg install git
Clone Mike Griffin’s GitHub repository with his code for Graphviz network diagram.
% mkdir ~/scratch
% cd ~/scratch
% git clone https://github.com/mgriffin/graphviz_network
% cd graphviz_network
% ls -a
.          .git        graph.png       Makefile
..         graph.dot   images          README.md
% cp -i graph.dot graph.dot.bak.1
% sed -i'.BAK.1' -e "/images/s/images\///" graph.dot
% diff --unified=0 graph.dot.BAK.1 graph.dot
--- graph.dot.BAK.1     2022-02-26 10:50:49.928865000 -0800
+++ graph.dot   2022-02-26 10:50:54.897383000 -0800
@@ -19,4 +19,4 @@
-  sw1 [ label="192.168.1.101" shape=none image="images/gigabitSwitch.png" labelloc=b color="#ffffff"];
-  sw2 [ label="192.168.1.100" shape=none image="images/gigabitSwitch.png" labelloc=b color="#ffffff"];
-  sw3 [ label="192.168.1.252" shape=none image="images/gigabitSwitch.png" labelloc=b color="#ffffff"];
-  sw4 [ label="192.168.1.251" shape=none image="images/gigabitSwitch.png" labelloc=b color="#ffffff"];
+  sw1 [ label="192.168.1.101" shape=none image="gigabitSwitch.png" labelloc=b color="#ffffff"];
+  sw2 [ label="192.168.1.100" shape=none image="gigabitSwitch.png" labelloc=b color="#ffffff"];
+  sw3 [ label="192.168.1.252" shape=none image="gigabitSwitch.png" labelloc=b color="#ffffff"];
+  sw4 [ label="192.168.1.251" shape=none image="gigabitSwitch.png" labelloc=b color="#ffffff"];
@@ -27 +27 @@
-           image="images/router.png" ,
+           image="router.png" ,
@@ -31 +31 @@
-  ap1 [ label="192.168.1.61" shape=none image="images/wireless.png" labelloc=b color="#ffffff"];
+  ap1 [ label="192.168.1.61" shape=none image="wireless.png" labelloc=b color="#ffffff"];
@@ -33 +33 @@
-  servers [ label="Servers" shape=none image="images/servers.png" labelloc=b color="#ffffff" ];
+  servers [ label="Servers" shape=none image="servers.png" labelloc=b color="#ffffff" ];
@@ -35 +35 @@
-  cloud [ label="The Internet" shape=none, image="images/cloud.png" labelloc=b color="#ffffff"]
+  cloud [ label="The Internet" shape=none, image="cloud.png" labelloc=b color="#ffffff"]
% sed -i'.BAK.2' -e '6a\\
   imagepath="/usr/home/dusko/scratch/graphviz_network/images"' graph.dot
% diff --unified=0 graph.dot.BAK.2 graph.dot                                                              --- graph.dot.BAK.2     2022-02-26 10:50:54.897383000 -0800
+++ graph.dot   2022-02-26 10:53:42.544648000 -0800
@@ -6,0 +7 @@
+  imagepath="/usr/home/dusko/scratch/graphviz_network/images"
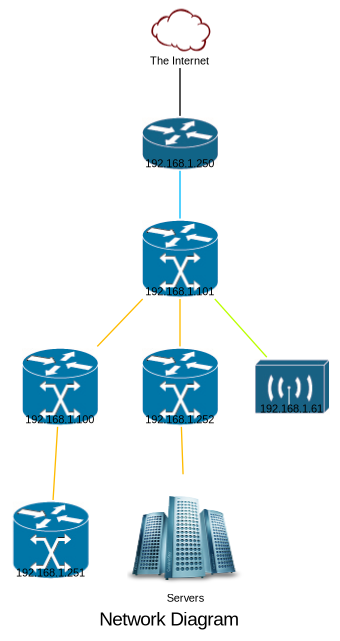
% cat graph.dot
graph switches {
  // colours for the lines relate to the line speed
  // #00bbff is for gigabit
  // #ffbb00 is for 100Mbit
  // #bbff00 is for 10 Mbit

  imagepath="/usr/home/dusko/scratch/graphviz_network/images"
  label="Network Diagram";
  fontname="arial";

  node [
    shape=box,
    fontname="arial",
    fontsize=8,
    style=filled,
    color="#d3edea"
  ];
  splines="compound"

  sw1 [ label="192.168.1.101" shape=none image="gigabitSwitch.png" labelloc=b color="#ffffff"];
  sw2 [ label="192.168.1.100" shape=none image="gigabitSwitch.png" labelloc=b color="#ffffff"];
  sw3 [ label="192.168.1.252" shape=none image="gigabitSwitch.png" labelloc=b color="#ffffff"];
  sw4 [ label="192.168.1.251" shape=none image="gigabitSwitch.png" labelloc=b color="#ffffff"];


  router [ label= "192.168.1.250",
           shape=none ,
           image="router.png" ,
           labelloc=b ,
           color="#ffffff" ];

  ap1 [ label="192.168.1.61" shape=none image="wireless.png" labelloc=b color="#ffffff"];

  servers [ label="Servers" shape=none image="servers.png" labelloc=b color="#ffffff" ];

  cloud [ label="The Internet" shape=none, image="cloud.png" labelloc=b color="#ffffff"]

  cloud -- router;
  router -- sw1 [color="#00bbff"];
  sw1 -- sw2 [color="#ffbb00"];
  sw1 -- sw3 [color="#ffbb00"];
  sw1 -- ap1 [color="#bbff00"];
  sw2 -- sw4 [color="#ffbb00"];
  sw3 -- servers [color="#ffbb00"];
}
% cat \
 graph.dot | \
 http \
 http://localhost:8000/plantuml/png \
 Content-Type:text/plain > \
 graph.png
% xv graph.png
TIP: Prevent Labels Overlapping Image Nodes by Padding
% cp -i images/gigabitSwitch.png .
% xv gigabitSwitch.png

Press the right mouse button for menu (keyboard equivalent: ?).
You can determine how large the selection rectangle is (in image coordinates) by bringing up the xv info window. Select Image Info from the Windows menu xv controls window or by pressing the i key inside any open xv window.
Windows > Image Info > Resolution: 77x78
So, this image’s size is 77x78.
NOTE:
For the rest of the steps, keep the Image Info window opened.
Click on Pad button.

- It brings up the dialog box shown below
- Keyboard Equivalent: P
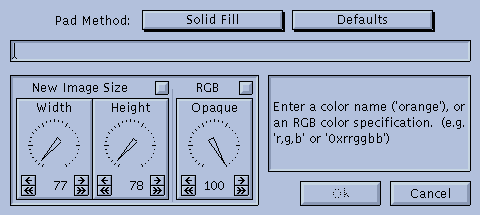
The Pad command lets you add a border of a specified size to the edges of the image. It also lets you resize images to some desired size without manually expanding or cropping the image.
The Pad command operates this way: A new image of the desired size is created, it is filled as specified, and the original image is pasted onto this new image, centered. If the new image is smaller than the original image, the original image will be cropped. Otherwise, the area outside the original image will have the new background.
In the Pad Method menus:
Solid Fill
Defaults > white
In the Image Size dials:
Change Height by moving the dial from 78 to 98
The image size now: 77x98.

Select same width and height as the original size; that is: 77x78.
NOTE:
Selecting in xv:
Clicking and dragging the left button of the mouse inside the image window will allow you to draw a selection rectangle on the image. If you’re unhappy with the one you’ve drawn, simply click the left button and draw another. If you’d like the rectangle to go away altogether, click the left button and release it without moving the mouse.

To confirm the selection, from the Windows menu choose Image Info:
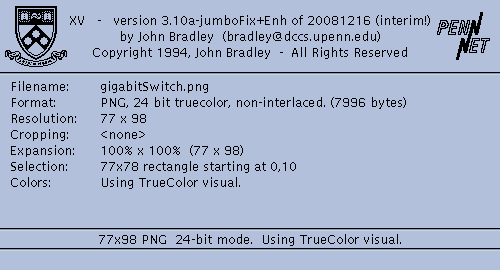
Click Cut button.

The image is displayed as:

Move the selected area to the very top of the image.

To confirm, from the Windows menu choose Image Info:

Click Paste button twice.

The image currently has a different colour at the bottom:

To remove the selection rectangle, click the mouse left button (anywhere in non-selected area) and release it without moving the mouse:

Double-click the left mouse button inside the image to create a selection rectangle the size of the currently displayed area of the image.

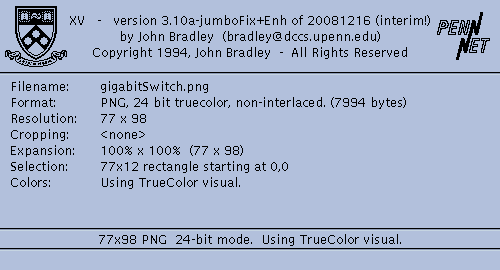
Reduce the height of the selection area: Hold the <Shift> key down while pressing the up arrow key on your keyboard until the Selection (in the Image Info window) is 77x12.

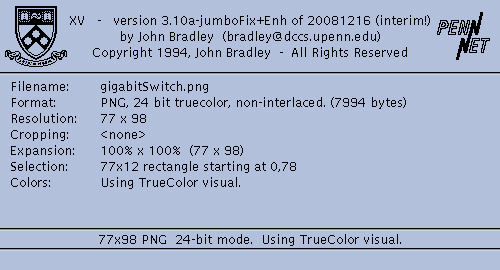
Move the selection rectangle by holding the down arrow key until the Selection (in the Image Info window) is: 77x12 rectangle starting at 0,78.

Prepare for clearing the selected area: Set the current color by clicking the middle mouse button anywhere below the selection rectangle. After that, click Clear button (keyboard equivalent: <Meta> d (often Alt d or Ctrl d)).


To remove the selection rectangle, click the mouse left button (anywhere in non-selected area) and release it without moving the mouse:

Double-click the left mouse button inside the image to create a selection rectangle the size of the currently displayed area of the image.

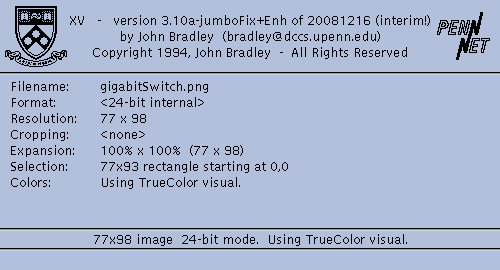
Reduce the height of the selection area: Hold the <Shift> key down while pressing the up arrow key on your keyboard until the Selection (in the Image Info window) is 77x93.
Click the Save button.
In the xv Save window, in the ‘Save file:’ enter the file name (in this case, gigabitSwitch.png).
Click Ok.
In the “Save PNG file…” window, click Ok.
In the confirmation window ‘Overwrite existing file /path/to/gigabitSwitch.png’?, click Ok.
Click Quit.
Repeat for all other nodes that have their labels overlapping them.
The resulting (beautified) graph:
![]()
References:
https://kroki.io/
https://demo.kroki.io/
https://kroki.io/examples.html
https://docs.kroki.io/kroki/
https://docs.kroki.io/kroki/setup/install/
https://docs.kroki.io/kroki/setup/manual-install/
https://docs.kroki.io/kroki/setup/configuration/
https://github.com/yuzutech/kroki
https://github.com/yuzutech/kroki/tree/main/server
https://docs.kroki.io/kroki/setup/http-clients/
https://docs.kroki.io/kroki/setup/kroki-cli/
https://github.com/yuzutech/kroki/tree/main/server
https://github.com/yuzutech/kroki/releases
https://github.com/httpie
Mike Griffin’s GitHub repository contains the code used in his graphviz tutorial blog post