OS: FreeBSD 13
Shell: csh
% cat graph.dot
graph networkdiagram {

  /*
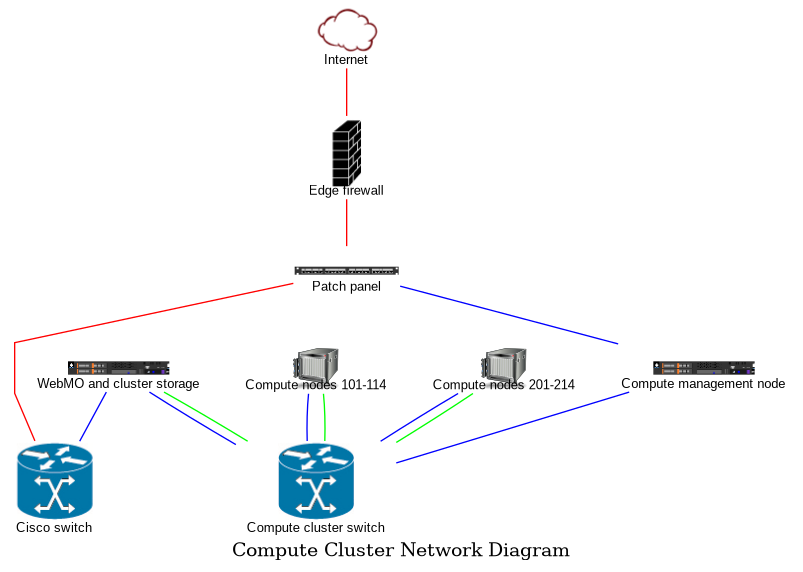
     Colours for the lines relate to the line speed
     green is for 100 Mbit (100 Mb/s) (IBM Management)
     blue is for Gigabit (1 Gb/s)
     red is for 10 Gigabit (10 Gb/s)
  */

  imagepath="/usr/home/dusko/scratch/graphviz_network/images"

  label="\nCompute Cluster Network Diagram";

  node [shape="none", fontname="arial", fontsize=10, labelloc="b", color="#ffffff"];
  splines="compound";

  fw [label="Edge firewall", image="firewall.png"];
  panel [label="Patch panel", image="patchPanel24Port.png"];
  sw1 [label="Cisco switch", image="gigabitSwitch.png"];
  sw2 [label="Compute cluster switch", image="gigabitSwitch.png"];
  srv1 [label="WebMO and cluster storage", image="rackmountServer1U.png"];
  srv2 [label="Compute nodes 101-114", image="serverBlades.png"];
  srv3 [label="Compute nodes 201-214", image="serverBlades.png"];
  srv4 [label="Compute management node", image="rackmountServer1U.png"];
  cloud [label="Internet", image="cloud.png"];

  cloud -- fw [color="red"];
  fw -- panel [color="red"];
  sw1 -- panel [color="red"];
  panel -- srv4 [color="blue"];

  {
    rank="same";
    srv1; srv2; srv3; srv4;
  }

  srv1 -- sw1 [color="blue"];
  srv1 -- sw2 [color="blue"];
  srv1 -- sw2 [color="green"];
  srv2 -- sw2 [color="blue"];
  srv2 -- sw2 [color="green"];
  srv3 -- sw2 [color="blue"];
  srv3 -- sw2 [color="green"];
  srv4 -- sw2 [color="blue"];
}
To generate the diagram with Graphviz:
% dot -Tpng graph.dot -o graph.png
To generate the diagram with PlantUML via a self-managed instance of Kroki (How to Run Kroki on FreeBSD 13 with Java or How to Run Kroki on FreeBSD 13 with vm-bhyve and Debian GNU/Linux VM):
% cat \
 graph.dot | \
 http \
 http://localhost:8000/plantuml/png \
 Content-Type:text/plain > \
 graph.png
NOTE:
Supported output formats in PlantUML: png, svg, jpeg, base64, txt or utxt.
% xv graph.png

NOTE:
Online Graphviz tools
- For realtime collaboration: http://graphvizrepl.com
- Repository with the code for graphvizrepl.com: https://github.com/caseywatts/graphviz-repl
Graphviz-REPL gives you a two-pane interface for quickly creating and iterating through graphviz diagrams. You type DOT syntax on the left, and the image will appear on the right after just a moment.
References:
How to create a network diagram with Graphviz - A graphviz tutorial
(Retrieved on Mar 3, 2022)- Repository with the code Mike Griffin used in his graphviz tutorial blog post above
(Retrieved on Mar 3, 2022)
- Repository with the code Mike Griffin used in his graphviz tutorial blog post above
Using Graphviz dot for ERDs, network diagrams and more
(Retrieved on Mar 3, 2022)Auto Network Diagram with Graphviz
(Retrieved on Mar 3, 2022)The Hitchhiker’s Guide to PlantUML - Create a Diagram of a Typical Network
(Retrieved on Mar 3, 2022)Graphviz for Network Visualization (Draw network diagrams from config files)
(Retrieved on Mar 3, 2022)Graphviz - Node Shapes
(Retrieved on Mar 3, 2022)Graphviz (dot) examples
(Retrieved on Mar 3, 2022)Plotting the hierarchy of SQL data types with graphviz/dot
(Retrieved on Mar 3, 2022)Graphviz example: organization chart
(Retrieved on Mar 3, 2022)GraphViz Node Placement and Rankdir
(Retrieved on Mar 3, 2022)Graphviz (dot) examples: crossing of edges - How crosssing of edges can be eliminated
(Retrieved on Mar 3, 2022)How does a script optimally layout a pure hierarchical graphviz/dot graph?
(Retrieved on Mar 3, 2022)Nodes as Labels
(Retrieved on Mar 3, 2022)The Cisco network topology icons
(Retrieved on Mar 3, 2022)